This post documents my plot of arrests associated with the 2021 January 6 insurrection at the US Capitol.
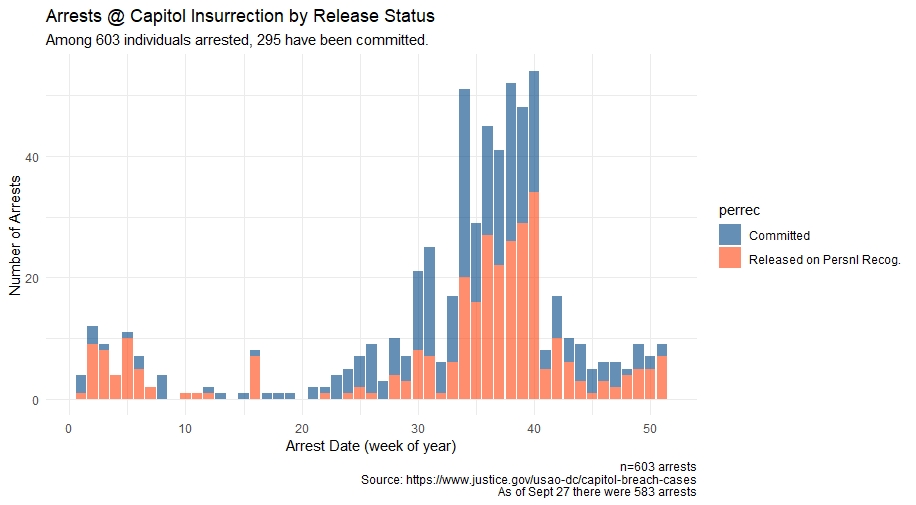
What proportion of those arrested have been left to their own recognizance awaiting trial?
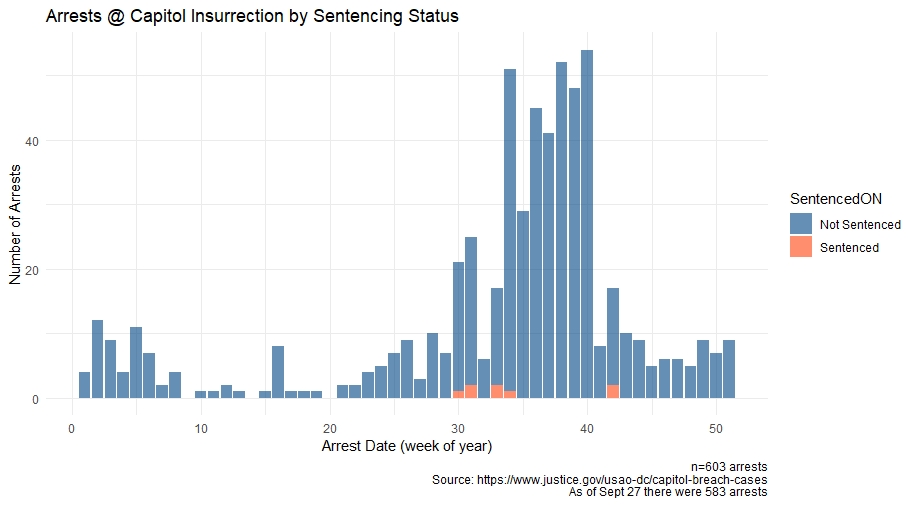
What proportion of those arrested have been sentenced?
library(tidyverse);library(tidyr)
library(rvest);library(ggthemes);library(plotly)

temp<-rvest::read_html("https://www.justice.gov/usao-dc/capitol-breach-cases") %>% html_table()
t<-as.data.frame(temp[1])
write.csv(t,paste0("c:/bac/data/DOJ_Insurrection_Arrests_",Sys.Date(),".csv"))

# parse the date from case.status
library(parsedate)
t$arrestDate<-parsedate::parse_date(t$Case.Status)
# for dates prior to 2021, change year to 2021
lubridate::year(t$arrestDate) <-lubridate::year(t$arrestDate)<-2021


## Clean Charges data
# parse the Charge.s column by the semi-colon character into new  cols
t<-t %>% tidyr::separate(Charge.s.,
                         into=c("ch.1","ch.2","ch.3","ch.4","ch.5","ch.6","ch.7","ch.8","ch.9","ch.10","ch.11","ch.12"),
                         ";",remove = FALSE,
                         extra = "merge")

# Count the number of charges per person (sum across columns)
t$numcharges<- rowSums(nchar(as.matrix(t[,c(3:14)]))>1,na.rm = TRUE)

# Create binary vars for particular charges
t$ch_destruction<-ifelse(str_detect(toupper(t$Charge.s.),"DESTRUCTION"),1,0)
t$ch_violence<-ifelse(str_detect(toupper(t$Charge.s.),"VIOLEN"),1,0)
t$ch_threat<-ifelse(str_detect(toupper(t$Charge.s.),"THREAT"),1,0)
t$ch_weapon<-ifelse(str_detect(toupper(t$Charge.s.),"WEAPON"),1,0)
t$ch_assault<-ifelse(str_detect(toupper(t$Charge.s.),"ASSAULT"),1,0)

t$ch_assault<-factor(t$ch_assault,levels=c(0,1),labels=c("Not Assault","Assault"))

t$ch_type<-ifelse(t$ch_weapon==1 | t$ch_assault==1 |
                    t$ch_threat==1|
                    t$ch_violence==1|t$ch_destruction,"Viol/aslt/destrxn/threat","Other")

t$perrec<-ifelse(str_detect(t$Case.Status,"personal recogni"),1,0)# release recognizance
t$perrec<-factor(t$perrec,levels=c(0,1), labels=c("Committed","Released on Persnl Recog."))

# sentencing status/dates
t$SentencedON<-ifelse(str_detect(t$Case.Status,"Sentenced on"),1,0)
t$SentencedON<-factor(t$SentencedON, levels = c(0,1), labels =c("Not Sentenced", "Sentenced"))


### Create plots
numcommitted<-t %>% dplyr::filter(perrec=="Committed") %>% dim() # annotation for plot

ggplot(t, aes(lubridate::week(arrestDate),
              fill=SentencedON))+
  geom_bar(stat='count', alpha=.6, position = "stack")+
  theme_minimal()+scale_fill_calc()+
  xlab("Arrest Date (week of year)")+ylab('Cumulative Arrests')+
  labs(title="Arrests @ Capitol Insurrection by Sentencing Status",
       caption=paste0("n=",dim(t)[1]," arrests\nSource: https://www.justice.gov/usao-dc/capitol-breach-cases\nAs of Sept 27 there were 583 arrests"))


ggplot(t, aes(lubridate::week(arrestDate),
              fill=perrec))+
  geom_bar(stat='count', alpha=.6, position = "stack")+
  theme_minimal()+scale_fill_calc()+
  xlab("Arrest Date (week of year)")+ylab('Cumulative Arrests')+
  labs(title="Arrests @ Capitol Insurrection by Release Status",
       subtitle =paste("Among",dim(t)[1],"individuals arrested,",numcommitted[1],
                               "have been committed."),
       caption=paste0("n=",dim(t)[1]," arrests\nSource: https://www.justice.gov/usao-dc/capitol-breach-cases\nAs of Sept 27 there were 583 arrests"))